
Eight out of 10 top-tier English councils are pushing ahead with a council tax rise of at least 5% this April, with the vast majority going straight for the maximum amount they’re legally allowed to take.
All 153 authorities have now confirmed their plans for the 2026/27 financial year, and for most households, the picture is pretty stark. It’s a bit of a perfect storm for local government; costs for things like social care and temporary housing are through the roof, and many councils are arguing that they simply have no other choice if they want to keep the lights on. For the average person, it’s just one more bill going up at a time when things are already tight enough.
Only a quarter of councils held back.
Only 28 councils across the country chose not to go for the full 4.99% increase, and even then, many of those only stayed slightly under the line. On the flip side, 7 authorities were actually given special permission by the government to bypass the standard cap because their finances are in such a state. In the most extreme cases, residents are looking at hikes of nearly 9%.
To put that into perspective, for someone in a Band D property, that could mean an extra £13 every single month. It might not sound like a fortune on its own, but when you add it to the rising cost of everything else, it’s a significant dent in the monthly budget.
What does council tax actually pay for?
If you live in or own a residential property, you’re on the hook for council tax, and the amount you pay is determined by which “band” your home falls into. These bands were famously set based on property values from all the way back in 1991, which is a bit of a weird system, but it’s what we’re stuck with.
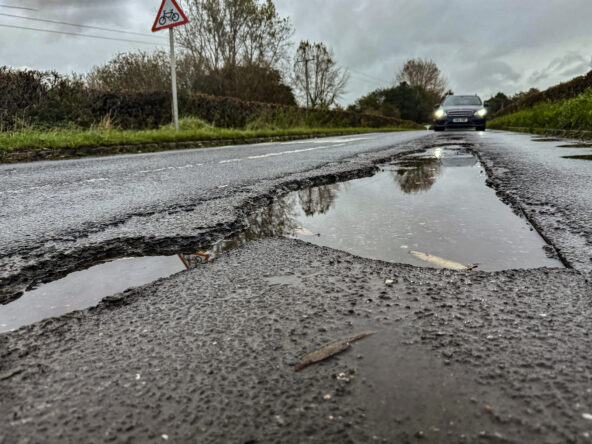
The money doesn’t just disappear into a black hole; it’s what pays for the essentials that keep your local area running. We’re talking about everything from fixing potholes and street lighting to emptying your bins and running local libraries. However, the biggest chunk of that money—usually more than half—actually goes towards adult and children’s social care, which is where councils are feeling the most pressure right now.
Some councils got special permission to go beyond the 5% cap.
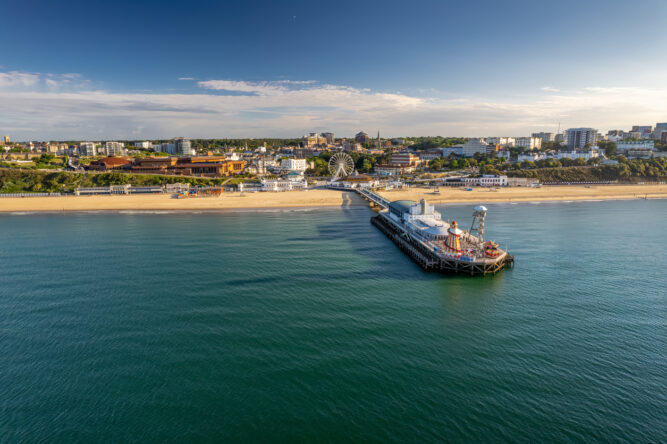
Bournemouth, Christchurch and Poole, North Somerset, Shropshire, Trafford, Warrington, Windsor and Maidenhead, and Worcestershire all had to ask for special dispensation to push their rates beyond the standard 4.99% limit. Most of these councils are dealing with historical debt or a sudden spike in the cost of providing basic services.
At the other end of the scale, Hartlepool saw the smallest rise at just 1.98%. It’s a bit of a controversial move there, as the ruling Labour authority had previously promised to freeze the tax entirely before realising the books just didn’t balance. It shows that even when councils want to give residents a break, the financial reality of running a town often gets in the way.
How to find your area
The full list below covers all county councils, London boroughs, metropolitan boroughs and unitary authorities, listed alphabetically within each section. Have a read through to discover how your area will fare, and how much your bills are likely to go up by this April.
County Councils A to L
Cambridgeshire (Eastern England), Lib Dem majority: 4.99%
Derbyshire (East Midlands), Ref majority: 4.90%
Devon (SW England), Lib Dem minority: 4.99%
East Sussex (SE England), Con minority: 4.99%
Essex (Eastern England), Con majority: 3.95%
Gloucestershire (SW England), Lib Dem minority: 4.99%
Hampshire (SE England), Con majority: 4.99%
Hertfordshire (Eastern England), Lib Dem minority: 4.99%
Kent (SE England), Ref majority: 3.99%
Lancashire (NW England), Ref majority: 3.80%
Leicestershire (East Midlands), Ref minority: 2.99%
Lincolnshire (East Midlands), Ref majority: 2.90%
County Councils N to W
Norfolk (Eastern England), Con majority: 4.99%
Nottinghamshire (East Midlands), Ref majority: 3.99%
Oxfordshire (SE England), Lib Dem majority: 4.99%
Staffordshire (West Midlands), Ref majority: 3.99%
Suffolk (Eastern England), Con majority: 4.99%
Surrey (SE England), Con minority: 4.99%
Warwickshire (West Midlands), Ref minority: 4.40%
West Sussex (SE England), Con majority: 4.99%
Worcestershire (West Midlands), Ref minority: 8.98%
London Boroughs A to H
Barking and Dagenham, Lab majority: 4.99%
Barnet, Lab majority: 4.98%
Bexley, Con majority: 4.99%
Brent, Lab majority: 4.99%
Bromley, Con majority: 4.99%
Camden, Lab majority: 4.99%
City of London, Ind majority: 4.99%
Croydon, Con minority: 4.99%
Ealing, Lab majority: 4.99%
Enfield, Lab majority: 4.99%
Greenwich, Lab majority: 4.99%
Hackney, Lab majority: 4.99%
Hammersmith and Fulham, Lab majority: 4.99%
Haringey, Lab majority: 4.99%
Harrow, Con majority: 4.99%
London Boroughs H to W
Havering, Residents minority: 4.99%
Hillingdon, Con majority: 4.99%
Hounslow, Lab majority: 4.99%
Islington, Lab majority: 4.99%
Kensington and Chelsea, Con majority: 4.99%
Kingston-upon-Thames, Lib Dem majority: 4.99%
Lambeth, Lab majority: 4.99%
Lewisham, Lab majority: 4.99%
Merton, Lab majority: 2.00%
Newham, Lab majority: 4.99%
Redbridge, Lab majority: 4.99%
Richmond-upon-Thames, Lib Dem majority: 4.99%
Southwark, Lab majority: 4.99%
Sutton, Lib Dem majority: 4.99%
Tower Hamlets, Aspire majority: 4.99%
Waltham Forest, Lab majority: 4.99%
Wandsworth, Lab majority: 2.00%
Westminster, Lab majority: 2.00%
Metropolitan Boroughs A to M
Barnsley (Yorkshire and Humber), Lab majority: 3.40%
Birmingham (West Midlands), Lab majority: 4.99%
Bolton (NW England), Lab minority: 4.99%
Bradford (Yorkshire and Humber), Lab majority: 4.99%
Bury (NW England), Lab majority: 4.99%
Calderdale (Yorkshire and Humber), Lab majority: 4.99%
Coventry (West Midlands), Lab majority: 3.95%
Doncaster (Yorkshire and Humber), Ref majority: 2.00%
Dudley (West Midlands), Con minority: 4.99%
Gateshead (NE England), Lab majority: 4.99%
Kirklees (Yorkshire and Humber), Lab minority: 4.99%
Knowsley (NW England), Lab majority: 4.99%
Leeds (Yorkshire and Humber), Lab majority: 4.99%
Liverpool (NW England), Lab majority: 4.99%
Manchester (NW England), Lab majority: 4.99%
Metropolitan Boroughs N to W
Newcastle-upon-Tyne (NE England), Lab minority: 4.99%
North Tyneside (NE England), Lab majority: 4.99%
Oldham (NW England), Lab minority: 4.99%
Rochdale (NW England), Lab majority: 4.99%
Rotherham (Yorkshire and Humber), Lab majority: 3.95%
Salford (NW England), Lab majority: 4.99%
Sandwell (West Midlands), Lab majority: 4.99%
Sefton (NW England), Lab majority: 4.99%
Sheffield (Yorkshire and Humber), Lab-Lib Dem-Green: 4.99%
Solihull (West Midlands), Con majority: 4.99%
South Tyneside (NE England), Lab minority: 4.95%
St Helens (NW England), Lab majority: 4.99%
Stockport (NW England), Lib Dem minority: 4.99%
Sunderland (NE England), Lab majority: 4.50%
Tameside (NW England), Lab majority: 4.99%
Trafford (NW England), Lab majority: 7.49%
Wakefield (Yorkshire and Humber), Lab majority: 4.99%
Walsall (West Midlands), Con majority: 4.99%
Wigan (NW England), Lab majority: 4.99%
Wirral (NW England), Lab minority: 4.99%
Wolverhampton (West Midlands), Lab majority: 4.99%
Unitary Authorities A to D

Bath and North East Somerset (SW England), Lib Dem majority: 4.99%
Bedford (Eastern England), Con minority: 4.99%
Blackburn with Darwen (NW England), Lab majority: 4.99%
Blackpool (NW England), Lab majority: 4.99%
Bournemouth, Christchurch and Poole (SW England), Lib Dem-Ind: 6.74%
Bracknell Forest (SE England), Lab minority: 4.99%
Brighton and Hove (SE England), Lab majority: 4.99%
Bristol (SW England), Green-Lib Dem: 4.99%
Buckinghamshire (SE England), Con minority: 4.99%
Central Bedfordshire (Eastern England), Ind minority: 4.99%
Cheshire East (NW England), Lab-Ind: 4.99%
Cheshire West and Chester (NW England), Lab minority: 4.99%
Cornwall (SW England), Lib Dem-Ind: 4.99%
Cumberland (NW England), Lab majority: 4.99%
Darlington (NE England), Lab-Lib Dem: 4.99%
Unitary Authorities D to M
Derby (East Midlands), Lab minority: 4.99%
Dorset (SW England), Lib Dem-Green: 4.99%
Durham (NE England), Ref majority: 1.99%
East Riding of Yorkshire (Yorkshire and Humber), Con minority: 4.99%
Halton (NW England), Lab majority: 4.99%
Hartlepool (NE England), Lab majority: 1.98%
Herefordshire (West Midlands), Con minority: 4.99%
Hull (Yorkshire and Humber), Lib Dem majority: 4.99%
Isle of Wight (SE England), Ind-Green: 4.99%
Isles of Scilly (SW England), Ind: 4.99%
Leicester (East Midlands), Lab majority: 4.99%
Luton (Eastern England), Lab majority: 4.99%
Medway (SE England), Lab majority: 4.99%
Middlesbrough (NE England), Lab majority: 2.00%
Milton Keynes (SE England), Lab majority: 4.99%
Unitary Authorities N to S
North East Lincolnshire (Yorkshire and Humber), Con minority: 4.50%
North Lincolnshire (Yorkshire and Humber), Con majority: 4.70%
North Northamptonshire (East Midlands), Ref majority: 4.99%
North Somerset (SW England), Lab-Lib Dem-Green-Ind: 8.99%
North Yorkshire (Yorkshire and Humber), Con minority: 4.99%
Northumberland (NE England), Con minority: 4.99%
Nottingham (East Midlands), Lab majority: 3.50%
Peterborough (Eastern England), Lab minority: 4.99%
Plymouth (SW England), Lab majority: 4.99%
Portsmouth (SE England), Lib Dem minority: 4.99%
Reading (SE England), Lab majority: 4.99%
Redcar and Cleveland (NE England), Lab minority: 4.99%
Rutland (East Midlands), Lib Dem minority: 2.00%
Shropshire (West Midlands), Lib Dem majority: 8.99%
Slough (SE England), Con minority: 4.99%
Unitary Authorities S to Y
Somerset (SW England), Lib Dem majority: 4.99%
South Gloucestershire (SW England), Lib Dem-Lab: 4.99%
Southampton (SE England), Lab majority: 4.99%
Southend-on-Sea (Eastern England), Lab-Lib Dem-Ind: 4.99%
Stockton-on-Tees (NE England), Lab minority: 4.95%
Stoke-on-Trent (West Midlands), Lab majority: 4.99%
Swindon (SW England), Lab majority: 4.99%
Telford and Wrekin (West Midlands), Lab majority: 4.99%
Thurrock (Eastern England), Lab majority: 4.99%
Torbay (SW England), Con minority: 4.99%
Warrington (NW England), Lab majority: 7.48%
West Berkshire (SE England), Lib Dem majority: 4.99%
West Northamptonshire (East Midlands), Ref majority: 4.95%
Westmorland and Furness (NW England), Lib Dem majority: 4.99%
Wiltshire (SW England), Lib Dem-Ind: 4.99%
Windsor and Maidenhead (SE England), Lib Dem majority: 7.49%
Wokingham (SE England), Lib Dem majority: 4.99%
York (Yorkshire and Humber), Lab majority: 4.99%
What Happens Next
The new rates come into effect in April 2026. Your council will write to you with your updated bill before then, and direct debit payments will adjust automatically if you pay that way. If your circumstances have changed, and you think you might be entitled to a reduction, contact your local council before the new billing period starts.